Welcome to vibeplot’s documentation!
Vibeplot presents a new and attractive way to visualize vibrational analysis from density functional calculations (DFT) in two dimensions. It is targeted at the chemists. The Open Babel/matplotlib interface can either be scripted or used interactively with QVibeplot. The idea is to display normal coordinates (converted displacements of the atoms within the molecule) in terms of changes of the internal coordinates.
- Bond-length changes, or stretching, are indicated by coloring the bonds. The linewidth is proportional to the amplitude of the movement.
- Angle changes (deformations involving three atoms) are indicated with an arc. The radius is proportional to the amplitude of the change.
- Torsion (dihedral angle) changes (think Newman projections) are indicated with Bezier curves pointing towards the atoms involved.
In any case, the phase is indicated by the color of the marker with the color indicating the sign of the change.
QVibePlot: the graphical user interface
QVibePlot is the graphical user interface (GUI) to interact with the Application programming interface (API).
Molecules from the free OrbiMol database are provided as a quick starter. They are found in the “File”, “OrbiMol DB molecules” menu of the program.
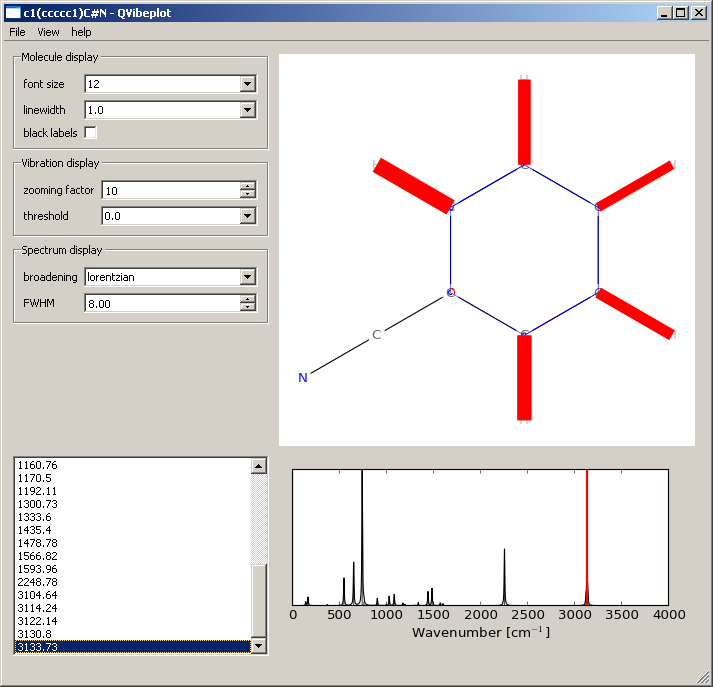
- The top-left pane displays options to tune the display of the image.
- The top-right pane shows the molecule and the visualization.
- The bottom-left pane displays the list of frequencies available for the molecule loaded.
- The bottom-right pane represents the spectrum, the currently selected vibration is marked in red. (Here, the CN stretch.)
Installation
QVibePlot for Windows
No installation is necessary for QVibePlot.
Download the latest Windows release from sourceforge, unzip the archive in an empty directory and run QVibePlot.exe from there.
Install from sources
Download the source from sourceforge or clone the git repository
https://github.com/Synss/vibeplot.git
and run python setup.py install from the root directory.
That will install both QVibePlot and the vibeplot module.
Dependencies
The Windows program was compiled with Python 3.4, PyQt5 5.3, matplotlib 1.4, and Open Babel 437feceb97.
The following was tested for QVibePlot 0.15:
- Python 2.7 and Python 3.4
- PyQt4 4.8 and PyQt5 5.3
- matplotlib 1.4 for PyQt5 support
- Open Babel, tested on Debian Jessie but the latest version from git is recommended.
Citation and support
QVibePlot and vibeplot are free softwares distributed under the BSD 3-clause license.
Support the program by citing the publication from the Journal of Chemical Education [laurin2013].
| [laurin2013] | Laurin, M. QVibeplot: A Program To Visualize Molecular Vibrations in Two Dimensions. J. Chem. Educ. 2013, DOI: 10.1021/ed300554z |